Home > General Information > Working with Graphs
Working with Graphs
Web Tracks gives you the ability to create custom graphs directly within the program. This graphing feature allows you to create graphs from single tables as well as joined tables. Every built-in graph included in Web Tracks was created using this tool.
Deleting a Graph
Select a graph from the list and click Delete. Be aware that you cannot undo the deletion.
Viewing a Graph
Double click on the graph in the graph list.
Designing a Graph
To add a graph to Web Tracks, click the 'Add' command from the graph list. Otherwise, select the graph you wish to design and click the design command (it is not recommended to change the design of the built-in graphs).
GENERAL TAB
Graph Title
This is a descriptive name for the graph. This name must be unique.
Graph Category
This is the category to which the graph will be assigned.
Inventory requires Web Tracks Inventory permissions to view.
Purchasing requires Web Tracks Purchasing permissions to view.
Help Desk requires Web Tracks Help Desk permissions to view.
Private?
If you check private the graph will be only available to the creator.
If private is not checked the graph will be viewable and designable by all users who have access to the graph category.
Graph Type
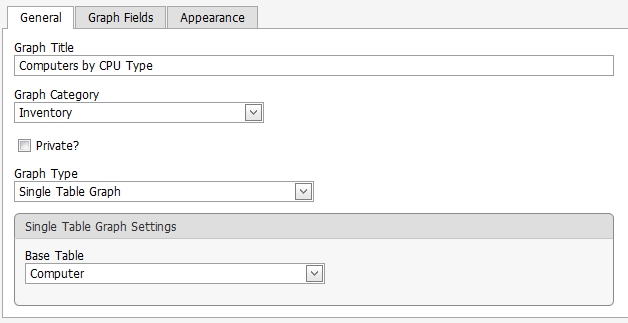
| Single Table Graph |
The above example is of a Single Table Graph. You can select fields from a single table on which to group or calculate |
| |
Base Table |
Choose the base table for your graph |
| |
|
| Joined Table Graph |
Selecting a Joined table graph would allow you to group by a field in the primary table and still calculate on a field in the joined table |
| |
Master/Child Relationship |
If you selected a Joined Table Graph, you then need to select a relationship type |
| Join Type |
| INNER JOIN |
Include records from the tables where the Join Fields are equal |
| LEFT JOIN |
Include all records from the Source Table and only the records in the Join Table where the Joined Fields are equal |
| RIGHT JOIN |
Include all records from the Join Table and only records from the Source Table where the Joined Fields are equal |
|
GRAPH FIELDS TAB
Chart Type
From the drop down list of chart types, you can select either Pie, Bar, Line, Point, Pyramid, or Radar. This is the default chart type that is displayed. You can always change the chart type when you're viewing the graph.
Group by
This is the field on which your graph will group. The unique values for this field will appear in the legend as well as label points on the graph.
Calculation Field
If the field is a numeric field, you will have your choice of seven aggregate functions to perform on the field. If the field is a text field, you can only choose the Count function. In fact, if the field is a text field, it doesn't matter what field you select for the calculated field. The count of the records will be the same as long as it's in the same table.
Calculation
If the field is a numeric field, you will have your choice of seven aggregate functions to perform on the field. If the field is a text field, you can only choose the Count function.
Note: You will receive an error if you try to calculate on a memo field.
Calculation Sort
Choose the sort direction for the graphed data.
Graph Filter
You may pre filter the graph by adding a filter to the graph definition.
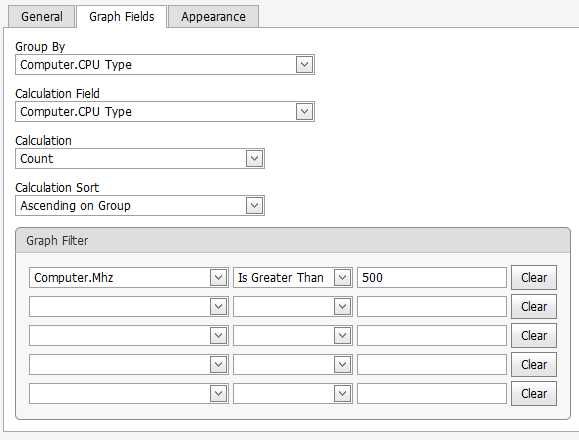
Example Explanation
The example listed in the above picture shows how you would create a graph that groups on CPU Type and Counts the number of each CPU Type. This example also filters CPUs on Mhz > 500.
If decided to group on CPU Type and calculate the CPU Speed (Avg), the graph would show the average CPU speed for each of your processors.
APPEARANCE TAB
Chart Type - Select the type of graph which will be displayed
Note: Depending on the chart's type not all of the options below will be available. The following settings change a the default appearance. These settings can be also be adjusted while viewing the graph.
Graph Appearance - Select a color theme for the graph.
Palette - Select the palette which the graph uses to color points
Label Display - Choose whether to display labels, values, both or neither.
3D? - Select to display the graph in 3D (not available for all chart types)
Label Position - Select the position of the labels rendered on the graph
Show Title? - If checked the Title text will be rendered with the graph.
Show Legend? - If checked the Legend will be rendered with the graph.
Show Criteria? - If checked the graph filter (where clause) will be rendered in the graph's footer.
See also
| 
 Page URL: